BGB
BGB is a Gameboy emulator with advanced debugging features. An overview of some of its debugging features is provided here.
Debugging is an extremely valuable skill if you're modifying any code in oracles-disasm, as it allows you to inspect variables and follow code flow.
See the online readme to see hotkeys, features, etc.
You may wish to review Background information before this.
Hotkeys
Open the debugger with the Escape key.
See the online readme for more information.
Symbol files
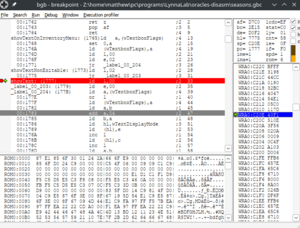
Whenever a ROM is built from oracles-disasm, a corresponding ".sym" file is created along with it. This file contains addresses for all of the labels in the disassembly, and most variables.
This is extremely useful for debugging. As you can see in the image to the right, if you have a .sym files, meaningful names are assigned to functions and most variables. Otherwise, they would just be numbers.
As an example, if you open "ages.gbc" in BGB, it will automatically look for a corresponding "ages.sym" symbol file, which will exist as long as you're running it from the oracles-disasm folder. So you should get these symbols automatically when running ROMs from the oracles-disasm folder.
This article will consider a .sym file to be a prerequisite for debugging. (It's possible without it, just much harder!)
Panels
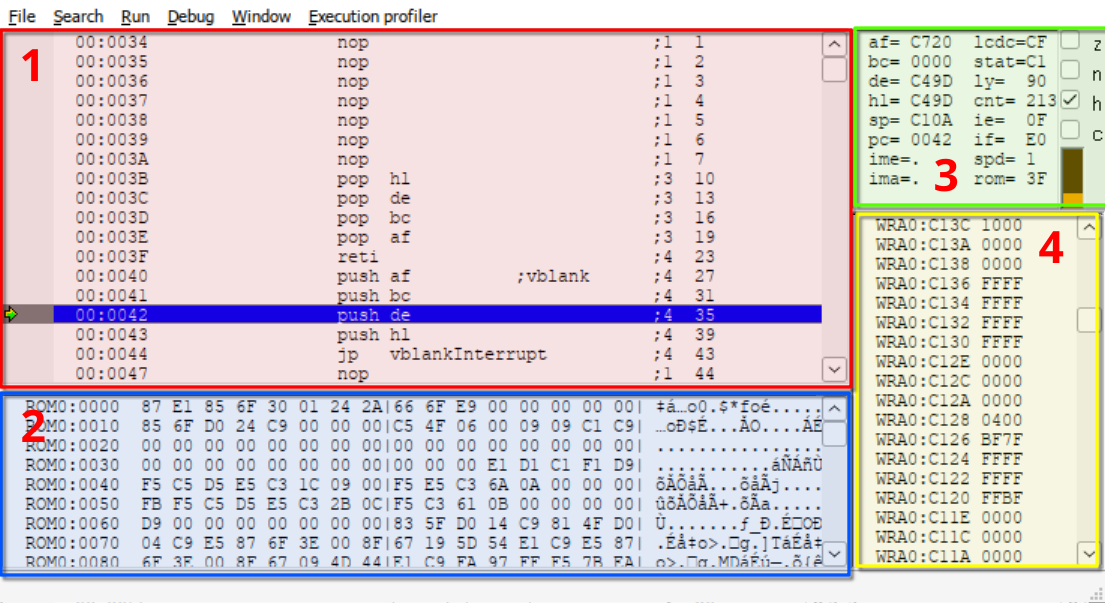
When you open the BGB debugger, you'll see the following panels.
1: Code view
2: Memory view
3: Register status
4: Stack view
The code view (1), memory view (2), and stack view (4) all show the same data, just represented in different ways. For example, in the above screenshot, the code view shows addresses 0034-003a as being "nop" opcodes. "nop" is represented as value 00, which can be seen in the memory view below that on the "ROM0:0030" row.
In this case the stack view is showing a different memory region, but all three views can be scrolled to see other parts of memory. Anyway, you probably won't use the stack view very much.
The register status (3) shows the values of the gameboy registers: af, bc, de, hl, pc, and sp. The value of "de", "c49d", means that d=c4 and e=9d. The "z" and "c" checkboxes represent the values of "z" and "c" used in conditional branches such as "jr z,..." or "jr nc,...". The rest of the data (ie. lcdc, stat) is not very relevant for our purposes.
Variables
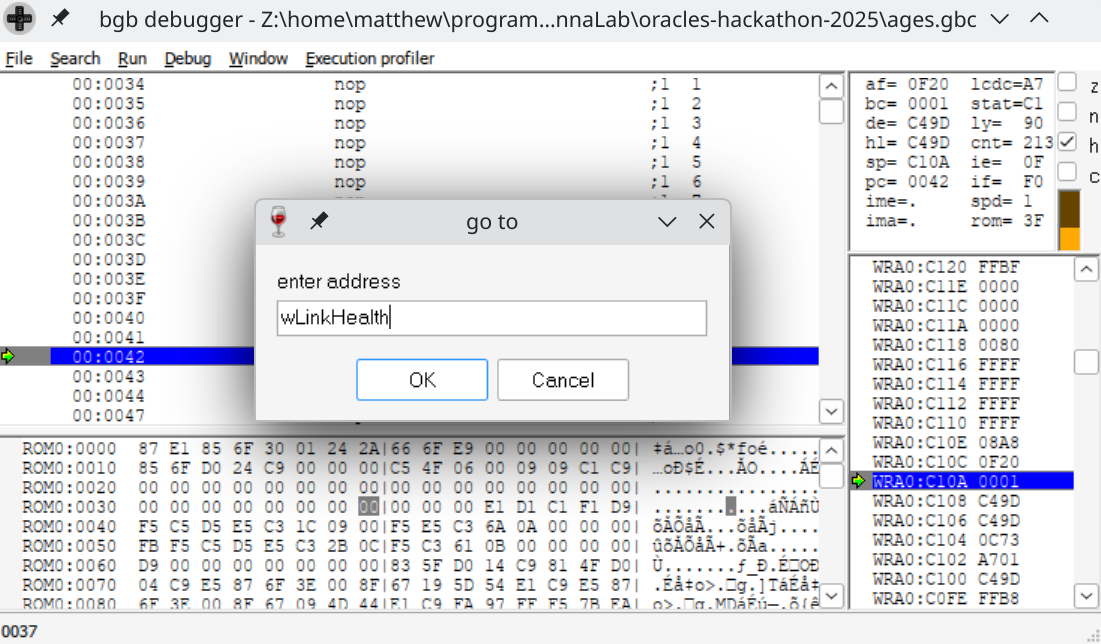
To locate a variable, click on the memory view (bottom panel), and press "Ctrl-G". A window will pop up. Enter the name of the variable you wish to find. (This should match identically with the name of the variable in include/wram.s.
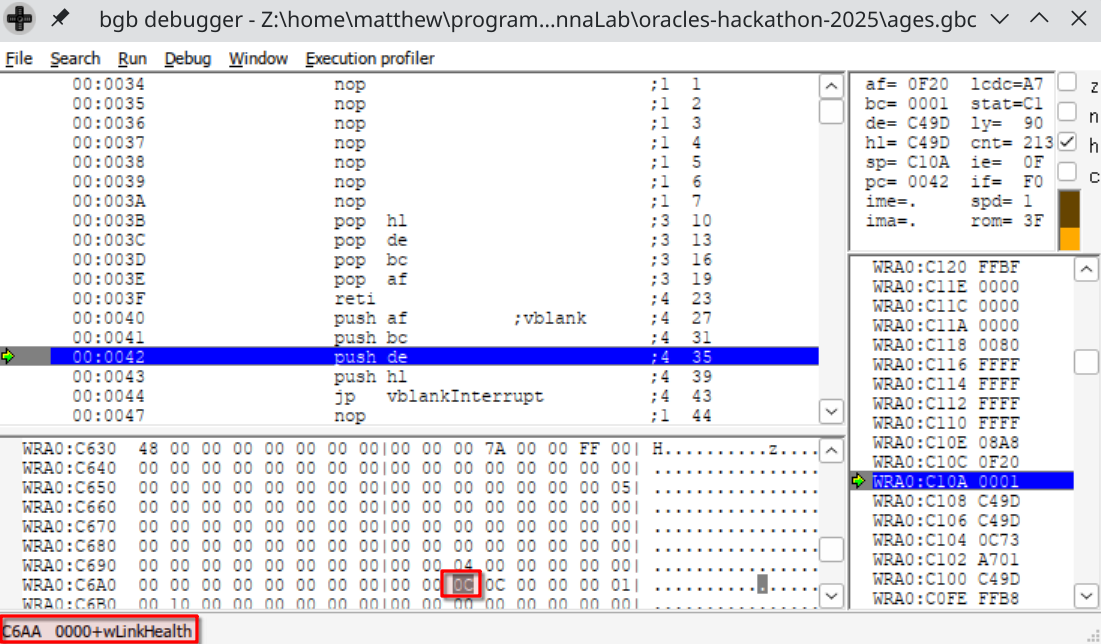
The memory viewer should show its value. This example shows the value of wLinkHealth, which is 0x0c, representing 3 full hearts.
To edit the value, right-click on it and select "modify code/data", or simply start typing a number while it's selected. You must enter exactly 2 digits. IE. If you entered "00", you'd set link's health to zero. (You could enter 4 digits to overwrite two bytes, 6 digits for three bytes, etc.)
Code flow
Locating functions
In the same way as locating variables, you can enter the name of the function to jump to it. Just ensure that you have the code view selected before pressing Ctrl+G.
Breakpoints
A breakpoint is a way to tell the debugger to halt code execution under a certain condition, ie. when a certain line of code is executed. This will allow you to inspect the state of the system at a specific line of code.
Breakpoints can be divided into code breakpoints (pause when code is executed) and access breakpoints (pause when memory is read or written). This section focuses on code breakpoints.
Press F2 to insert a breakpoint on a specific line of code. Then, return to the game and do something that would cause the breakpoint to trigger. Once it triggers, then you can press F7 to run code line-by-line, F9 to resume normal execution, etc.
ld b,b breakpoints
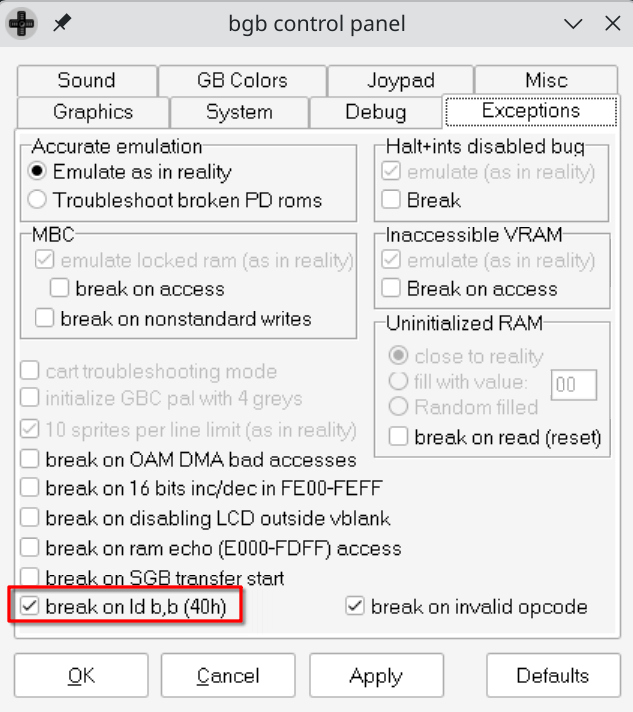
In BGB, press F11 to access options, go to the "Exceptions" tab, and enable "break on ld b,b". This will insert a breakpoint whenever you enter the opcode "ld b,b" in your code.
"ld b,b" doesn't do anything (well, it loads register 'b' with its own value, so effectively nothing). So this effectively hijacks that opcode so that you can use it to insert breakpoints wherever you like while writing your code. Remember to remove it when you're done debugging, though.
As an example, inserting "ld b,b" at the start of the "showText" function would cause code execution to pause there when you open a textbox:
showText:
	ld b,b
	ld l,$00
    [...]
BGB on Linux
BGB works well under Wine. But if the debugger text looks misaligned, try using winetricks to install "msfonts" so that it's using the correct, monospaced font.
